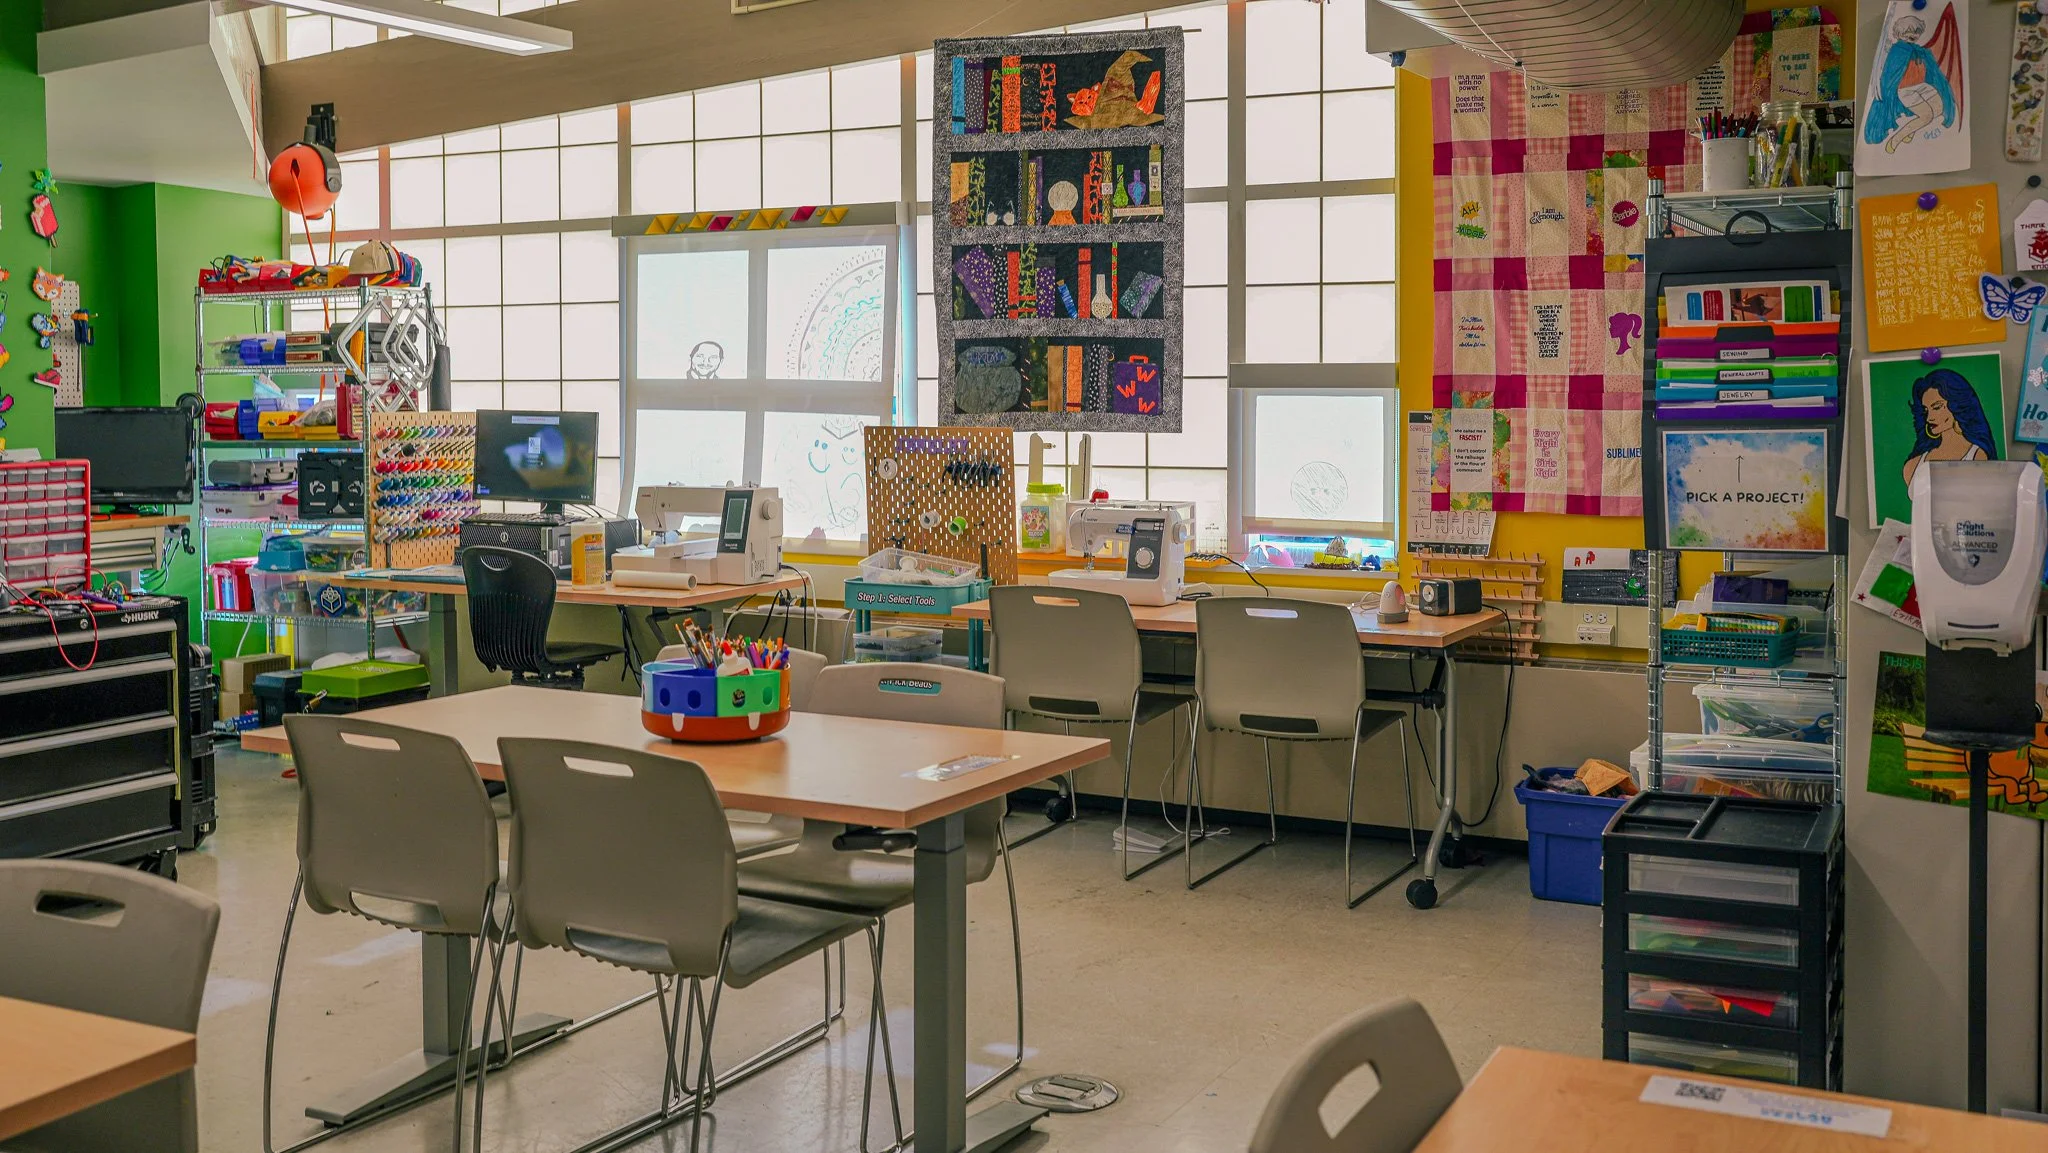
The ideaLAB at the Hadley branch of the Denver Public Library
What did you notice about the photo above?
Let’s back up – did you actually take a moment to look at the photo, or did you quickly scroll past it to get to this text?
If you haven’t already done so, take a moment to revisit the photo and take a closer look. What are you noticing and wondering that might have been left behind if you had just scrolled past?
This exercise is how I began my dissertation, which examined the often-undervalued and unseen work of educators and facilitators in creative learning spaces like museums and libraries. In my thesis, I advocated for exploring research and communication methods that took a more visual and creative approach than traditional research papers. In large part, this looked like crafting research papers in the “pictorial” format. My colleagues in the Creative Communities group and I love this format for communicating our work. However, in conversations with our research peers and partners, we’ve found that many folks aren’t familiar with pictorials and want to know more about what they are and why we like them. This blog post is dedicated to sharing more about how and why our group often uses pictorials to communicate our research.
Why explore visual approaches to research communication?
Typical academic publications prioritize text to communicate information. Visuals are generally limited to photos or figures that are contained within the boundaries of page margins, and are often considered to be supplementary rather than integral to the paper’s arguments. For some, this is an appropriate and adequate format that fully captures and communicates their research. However, in our group, much of the community-engaged research we do takes place in vibrant, highly sensory locations like museums and public library makerspaces, where youth, families, and educators engage in hands-on, material-rich activities. Even the richest textual descriptions of our observations within these environments can leave too much open to readers' interpretation.
If you’re wondering, “Why not include more, or larger pictures?” It’s important to understand that visual communication goes far beyond including visual elements like photos. Visual communication involves numerous considerations that can affect how readers engage with the content. Decisions such as how a page is arranged, how a photo is composed, how colors are used, and how the text references or engages with the visual can all have an impact. Consider the photo included at the beginning of this blog post again. How would your engagement with the photo differ if it had filled the screen, or if I had added annotations on top?
Additionally, we’ve found that text-heavy academic articles often don’t resonate with the creative and inventive informal educators, designers, and community members with whom we work. While a research publication typically serves and is intended for a research/academic audience, as community-engaged researchers, we take the stance that we should also produce resources that directly benefit the communities they emerge from, in formats that feel accessible and useful.
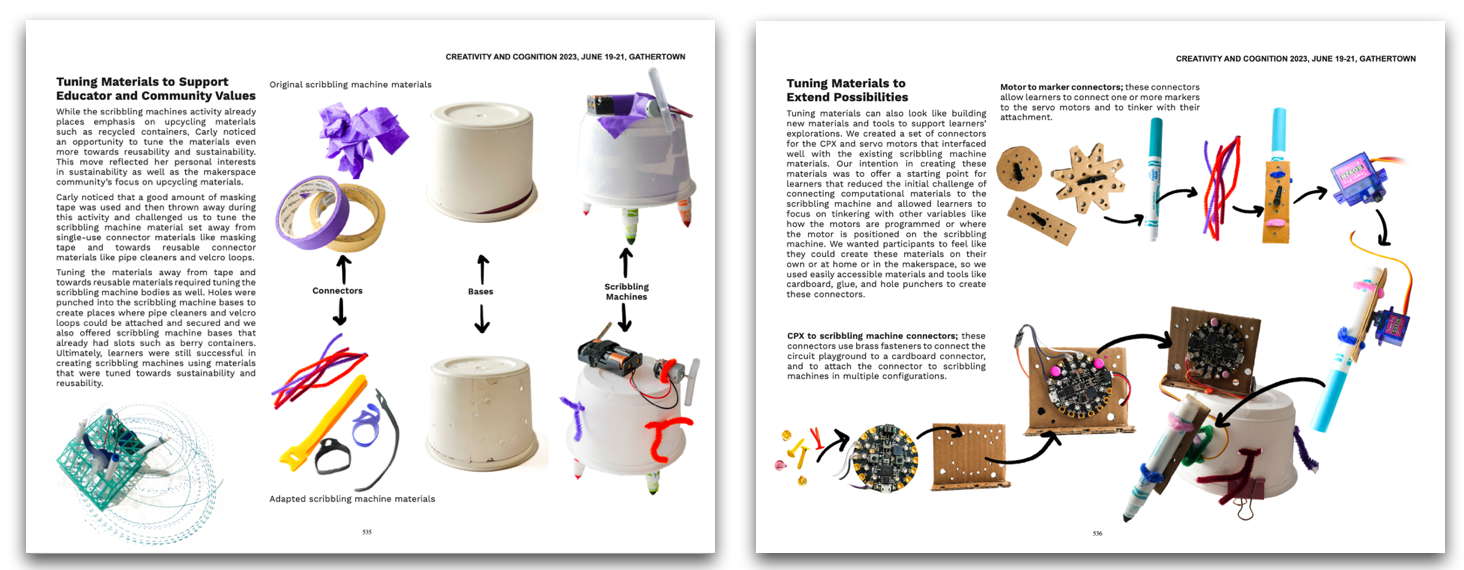
Two pages from our pictorial documenting the often unseen but instrumental “tuning practices” of making and tinkering educators to adapt a computational tinkering activity into their specific context to make it meaningful to their youth and families (Moreno & Roque, 2023)
The possibility of better engaging research partners and community members through more creative, visual research formats isn’t new. I’ve been inspired in the past by the artful “pedagogical zines” from the Blue Dandelion Collective and Augmented Fotonovelas created by Dr. Leigh-Anna Hidalgo. Our group also has a history of exploring visual strategies for conducting and communicating our research (like zines!). Additionally, when working with partners on co-design or co-analysis, we often use visual strategies like collaborative digital whiteboards and printing and displaying documentation to represent and co-construct our emergent and shared knowledge. Pictorial research papers build on what is exciting, innovative, and resonant about visual, creative research strategies and allow us to explore them further within an academic venue.
What is a pictorial?
Pictorials are a research paper format accepted in several ACM (Association for Computing Machinery) venues in which “the visual components (e.g., annotated photographs, Artwork, collages, diagrams, field notes, illustrations, photographs, renderings, sketches) are the primary means of conveying information with at least, if not more, importance as the accompanying text.” (Creativity & Cognition 2026). Critically, in a pictorial, the visual elements must be more than decorations, or supplemental material only there to support a textual narrative. The visuals in a pictorial play a major role in constructing knowledge, communicating research, and contributing new understandings to the field.
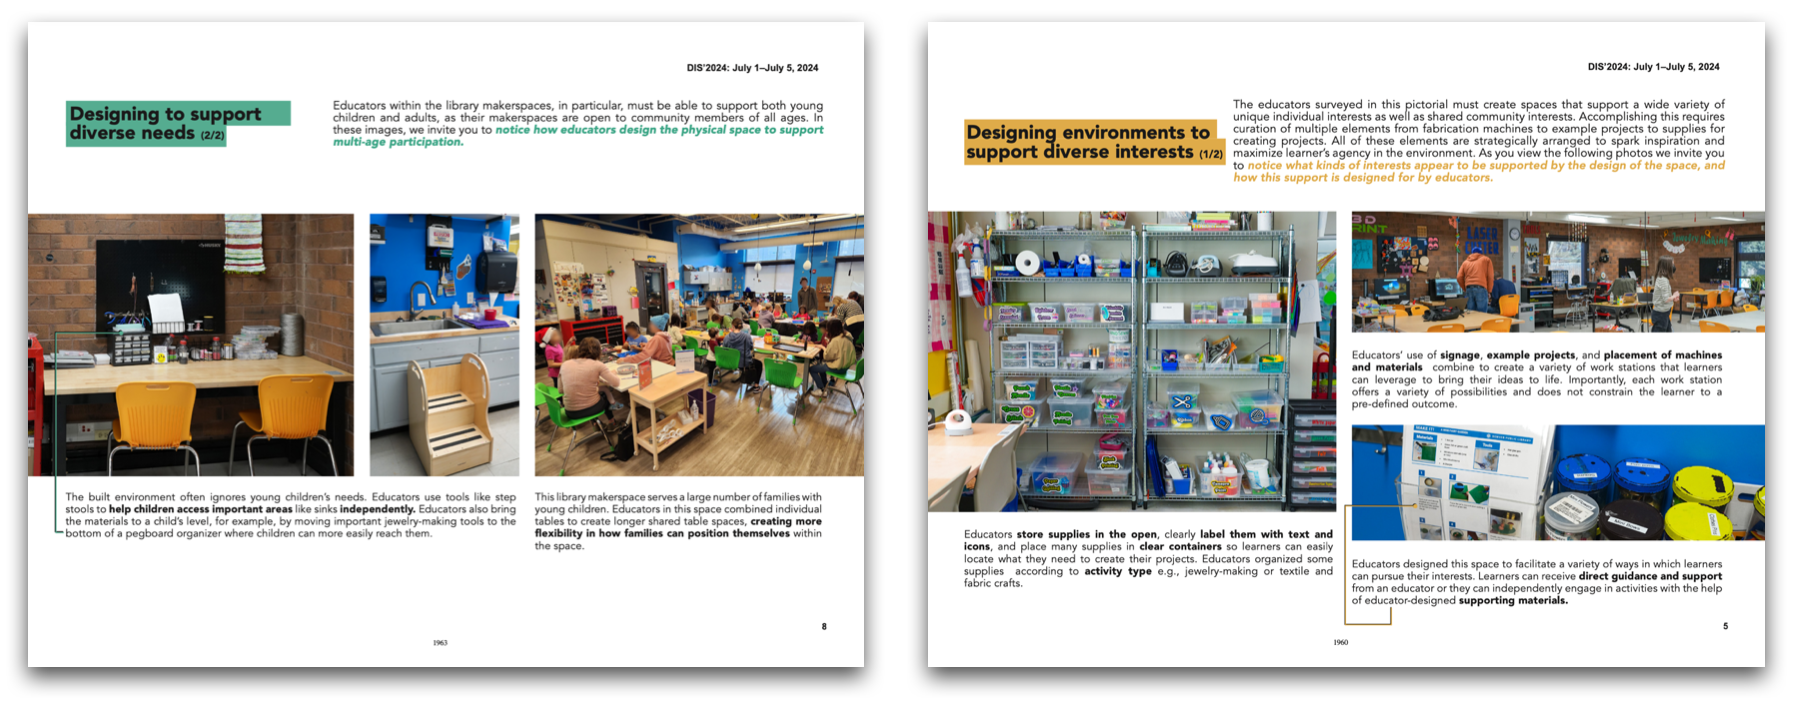
Two pages from our pictorial featuring a photo voice with educators in making and tinkering spaces. We highlight how educators are designers intentionally arranging and curating their spaces to meet the needs and interests of their learners (Moreno, Shalf, Roque, 2024)
Taking a look at previous pictorials is one of the best ways to better understand the affordances of this format. One of the first pictorials that captured our group’s attention and inspired our group was one by Jie Qi and others, which explored “collaborative electronics design through drawing games.” We thought this pictorial was exciting- not only was it well designed in such a way that emphasized the ideas of the paper, but it seemed like something that we could hand to our educator partners.
You can find more examples of pictorials in the proceedings for Creativity and Cognition, Designing Interactive Systems, Tangible Embedded Interfaces, and Interaction Design and Children. One easy way to dip your toes into pictorials is to look at the call for pictorials on the conference websites for these venues, which link to exemplar pictorials. For a comprehensive overview of pictorials, I like this pictorial (what better format??) titled, “A review of visual strategies in pictorials” by Rasmussen et al.
Our pictorials
So far, within the Creative Communities group, we’ve explored a variety of pictorial styles from sharing glimpses into our collaborative process as we worked with an illustrator to create comics based on our ethnographic research to sharing the results of a photo survey conducted with informal educators.
Here’s a full bibliography of our group’s pictorials:
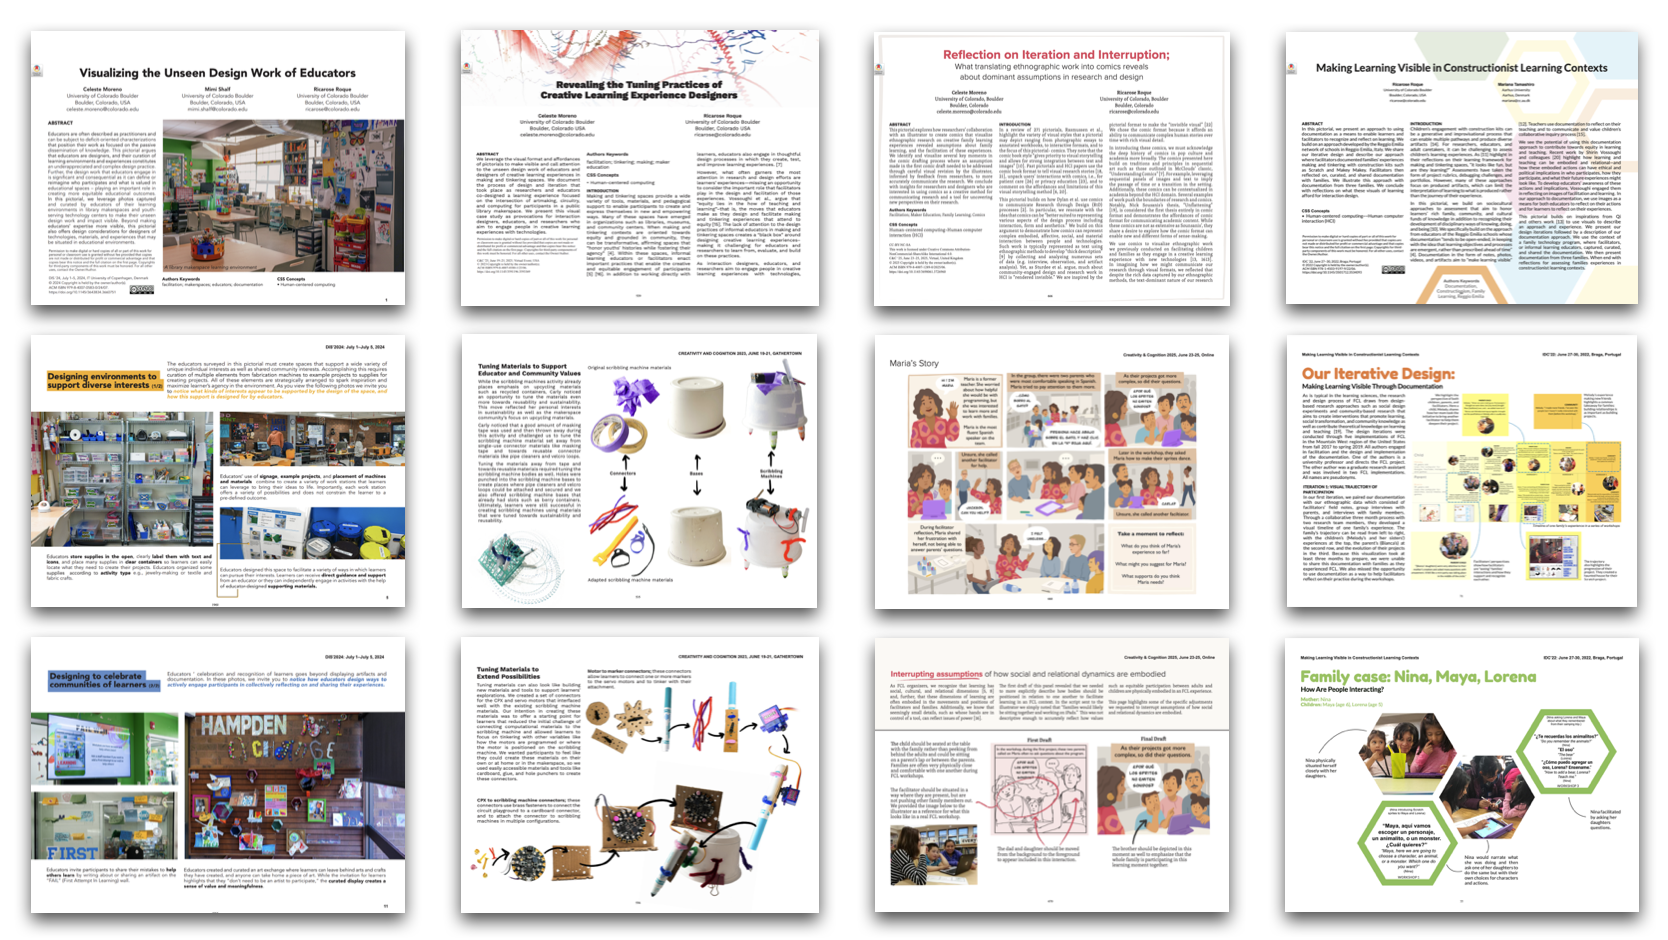
Pages from our various pictorials. Left to right: Moreno et al. (2024), Moreno et al. (2023), Moreno & Roque (2025), Roque and Tamashiro (2022)
Shalf, M., Moreno, C., Hayden, R., Roque, R. (2026) Zines as a movement point: engaging with the margin for alternative dreaming. In Proceedings of ACM Creativity and Cognition (C&C ‘26) Conference. London, U.K. (Forthcoming Link)
Moreno, C. & Roque, R. (2025) Reflection on Iteration and Interruption: What translating ethnographic work into comics reveals about dominant assumptions in research and design. In Proceedings of ACM Creativity and Cognition (C&C ‘25) Conference. Virtual. (LINK)
Moreno, C., Shalf, M., Roque, R. (2024) Visualizing the unseen design work of educators. In Proceedings of ACM Designing Interactive Systems (DIS ‘24). Copenhagen, Denmark. (LINK)
Moreno, C., Roque, R. (2023) Revealing the Tuning Practices of Creative Learning Experience Designers. In Proceedings of the ACM Creativity and Cognition (C&C ‘23) Conference. (LINK)
Roque, R. (2023) Imagining Alternative Visions of Computing: Photo-Visuals of Material, Social, and Emotional Contexts from Family Creative Learning. In Proceedings the ACM Interaction Design and Children (IDC ‘23) Conference. Chicago, IL, USA. (pp.68-81) (LINK)
Roque, R. and Tamashiro, M. (2022) Making Learning Visible in Constructionist Learning Contexts. In Proceedings of the ACM Interaction Design and Children (IDC ‘22) Conference. (pp. 69-81) Braga, Portugal. (Best Pictorial | LINK)
Reflections, and thoughts for the future
It’s encouraging to see the different ways that our community partners have found meaning in, and new uses for our group’s pictorials. We’ve seen partners print and display pages from our pictorials and use them to help their colleagues better understand their work. We’ve also shared the methods and insights from our pictorials in contexts like professional webinars, making it possible for educators beyond our circle of research partners to learn from our work and apply it to their own.
One of the exciting things about the format of pictorials is that it pushes the boundaries of what “knowledge” can look like. In academia and other spaces that share research, knowledge is often shared through a text-based format of a paper or a report, with only supplementary images or visuals. Using the pictorial format has also lowered the floor for our partners to participate in the process as they participate in how we collect photos, create visuals, and interpret them. Many of the ACM communities using the pictorial format are just getting started and still imagining and developing what successful pictorials can be. We look forward to continuing to contribute to this format and see what others, especially learning designers, contribute too.
For folks thinking about creating their own pictorials, I encourage you to think strategically about documentation. Taking photos with a nice camera, and with intention (see our “Imagining Alternative Visions of Computing” pictorial) goes a long way, but don’t let this be a barrier to entry. There are plenty of pictorials that have been created with no photography or lower-quality photos. It’s also helpful to have teammates and colleagues with an interest in or experience with graphic design.
As I reflect on how meaningful, creative, and expansive this medium has been for our team, I hope to see academic venues beyond those discussed here make more space for experimental and multimodal approaches to research communication.